
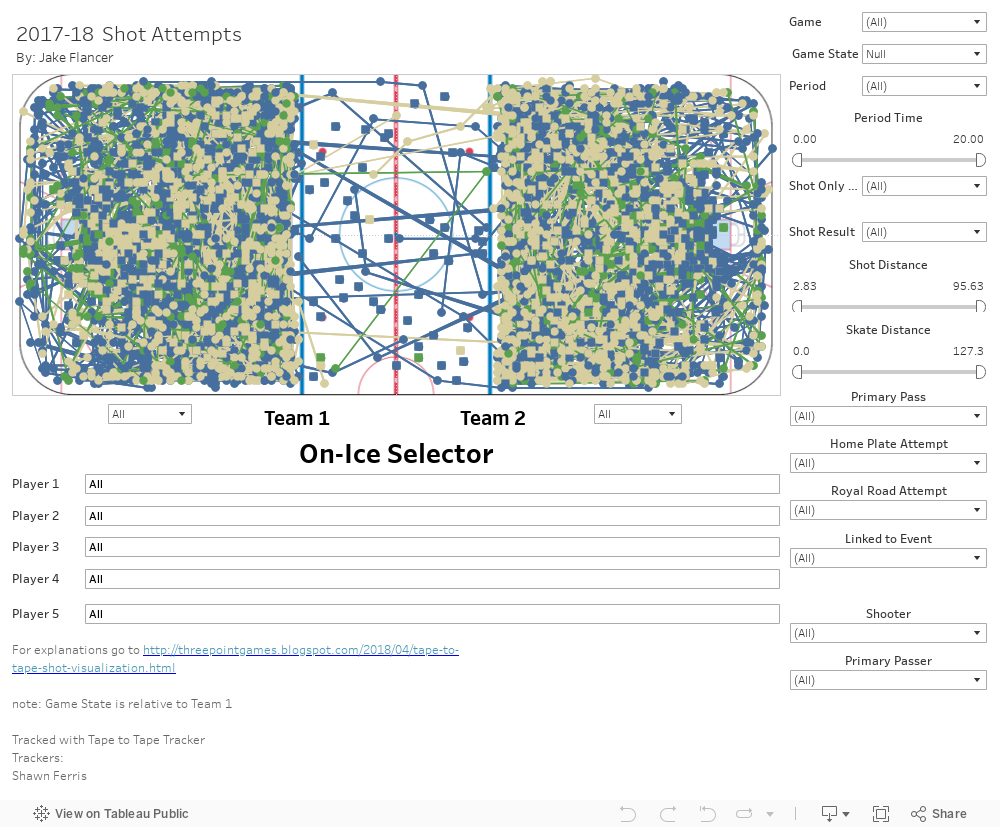
In this post, I'll be breaking down my newest (and favorite) viz, which acts as a pretty comprehensive overview of tape to tape shot data. This is based on my previous tape to tape viz but has many new features. I'm going to go through each component of the display below, and explain how they work. You'll be able to work with the viz at the bottom of the page, and any feedback or suggestions are greatly appreciated.
1) The Rink
First I'm going to explain what you're directly looking at. There are three parts to the rink: the points, the lines, and the tooltip (the box that pops out when you hover over a point/line). Both points and lines are colored by the event result. Goals are green, shots on goal are blue, and missed shots are tan.
There are two different points: a circle and a square. Circles represent either where a pass was made or received. Squares represent the location of shot attempts. Lines show the flow of events. They grow in size as the event gets closer to a shot attempt. The tooltip provides additional information about each event. Status tells you if the event was a pass start, pass reception, or a shot attempt. Directly below the status is a description of which players were involved in the event. Under is the shot result, either a missed shot, shot, or goal. Finally, the event team, event game, and event timing are listed. For some weird reason, the timing wasn't showing correctly on the tooltip for lines, but it works fine for points.
2) Team Selector
Teams are separated into Team 1 and Team 2. Team 1 will have their events oriented to the left side of the ice, and Team 2 to the right. You can only make a single selection for each side. At the moment, if you want to view one team vs. all competition this team must be selected in Team 1, not Team 2. Overall, this view effectively allows you to view a team vs. all competition or a team vs. another team.
3) On-Ice Selector
This is my favorite filter. It allows you to select up to five players on the ice for events. This can be made up of a combination of teammates and opponents. For example, if you want to look at the Bruins top line, you can enter "Patrice Bergeron", "David Pastrnak", and "Brad Marchand" and only events with these three players on the ice will be shown. Similarly, if you want to see how Bergeron and Matthews match-up, that can be filtered. Players must be entered as full names, but the filter does have an autofill feature so it isn't too burdensome. I thought five players was a reasonable cutoff, but it's not difficult to add more if people would prefer.
4) Game
This is pretty self-explanatory. Multiple or individual games can be selected with this filter. As I mentioned earlier, Team 1 must always have an individual team, so the games selected have to include that team.
5) Game State
Here you can select the game state, which is also rather self-explanatory. The state is relative to Team 1, which means that '5v4' filters as a power play for Team 1. This field will also be null when "All" is selected for both teams- this is because it won't know which way to orient plays.
6) Period/Period Time
I'm grouping these two filters together. They both don't really need much explanation. The only oddity is that Period Time is shown as a decimal, so 30 seconds is equivalent to 0.50, etc..
7) Shot Only View
With this filter, you can effectively remove the tape to tape pass information and just view the individual shot charts for each side.You can similarly remove shot information and just look at the passing patterns.
8) Shot Result
No explanation needed.
9) Primary Pass
This allows you to view only the final pass attempt/shot. This is a good filter if you just want to see the pass leading to the shot attempt. I also chose to omit where the pass was received for this filter, so it only shows a single line for each shot attempt (or just a point if there was no pass). Considering the reason for this filter is to simplify the visual, this seems like a reasonable thing to do, but I'd be open to changing it.
 |
| via |
10) Home Plate Attempt/Royal Road Attempt
Both of these filters let users select two special types of shot events. Home Plate Attempts are shots occurring in the home plate region. This qualifier has been written about in detail on a variety of websites, but basically acts as an arbitrary bin containing shot attempts with a high likelihood of being a goal.
 Royal Road Attempts are also an arbitrary cut off and describe a different set of high danger changes. These attempts are explained in detail here but are basically shots created off of cross-ice passes. For it to be counted in this display, the pass must have been made on one side of the lighter gray region and received on the other side of this region.
11) Shooter/Passer
These filters allow you to select individual players involved in the event. At the moment, you can select the player taking the shot attempt and/or the player making the pass directly resulting in the shot attempt (primary passer).
Here's the viz below, please let me know if there are any problems or if you have any suggestions. I'm not sure if I'll be able to add any more filters- as I believe more filters makes it slower and its pretty slow to update as is.
Comments
Post a Comment