All data via nhl.com
In this update, I have added the first 50 NHL seasons to my data, as well as changed the source to the newest NHL.com stats, which are described as more accurate. Now, in summary, I have the adjusted points values for every NHL season using the most accurate point totals available. I also created some new visuals and a hall of fame score, which will be explained below.
As a note, for seasonal and career stats, only seasons were used in which the given player played: GP >= max possible GP / 2. This was done to ensure the distribution represented all NHL regulars. You may notice some seasons are missing or point totals are off (ex. Marcel Dionne's '88-89 was omitted from analysis and totals because he only played in 37 games, and 37 < 80/2.
Here are updated graphs from my previous parts. HOF analysis will be below and updated Tableau

 As you may notice, the earlier seasons of the NHL were much more volatile, which we should expect as the league was just forming and many variables were changing during this time, such as GP, # of players, # of teams, etc. The trends mentioned in earlier parts appear much less pronounced, but multipliers for top players remained in the same general range.
Here is the graph of top seasons in history, still dominated by post-expansion players. Most players fall under a negative adjustment, which is displayed as under the white line y=x. The one cluster of points forming a trend at a greater slope (where 25 pts. -> 60 adjusted pts.) consists of players in the first several seasons in which the point rate was much less.


As shown in the visual, the model was applied to ineligible players to get a sense of who we should expect to make the HOF in future years. Here are the top 20s separated by position. Defensemen were given much lower likelihoods than forwards as a group, but Erik Karlsson stands out as an almost lock. We should expect Zubov and Gonchar to eventually make their way in, as expected. The long list of eligibles following the top group are much less likely to get in both on the model's predictions and by looking at the names. Several are past the point of eligibility and the remaining are a group of fringe contenders. Towards the bottom we see Letang leading the group of current players. Other active players of interest with (in my opinion) a likelihood of entering the HOF include Zdeno Chara (0.38) and Drew Doughty (0.22). Showing again that without award recognition, defensive defenseman are ignored.
 The forwards model provides a much clearer picture of what to expect. The top 5 are complete locks by the model and by general public opinion. In the next group are several players that are nearly identical stat-wise to many of the early inductees, but my hockey history knowledge cannot explain why they are omitted and others are not. The next grouping is a list of current era players, most of whom will likely be strong candidates for the HOF in the future. McDavid stands out because of his very strong PPG numbers. When setting a minimum for games played, the list is pretty much what is expected in this current batch of players and Herberts, Denneny, and Carson are omitted.
Orr - 0.9988738 (Highest D)
Lidstrom- 0.9550488 (5th D)
Maurice Richard- 0.9508771 (17th F)
Leetch - 0.9231727 (8th D)
Selanne - 0.9199010 (21st F)
Lindros - 0.8099994 (42nd F)
Hawerchuk - 0.7659057 (48th F)
Bure - 0.6784484 (65th F)
Pronger - 0.66935832 (20th D)
The Worst Scores:
Bob Gainey - 0.002817570 (Lowest F)
Jack Stewart - 0.003486746 (Lowest D)
In this update, I have added the first 50 NHL seasons to my data, as well as changed the source to the newest NHL.com stats, which are described as more accurate. Now, in summary, I have the adjusted points values for every NHL season using the most accurate point totals available. I also created some new visuals and a hall of fame score, which will be explained below.
As a note, for seasonal and career stats, only seasons were used in which the given player played: GP >= max possible GP / 2. This was done to ensure the distribution represented all NHL regulars. You may notice some seasons are missing or point totals are off (ex. Marcel Dionne's '88-89 was omitted from analysis and totals because he only played in 37 games, and 37 < 80/2.
Here are updated graphs from my previous parts. HOF analysis will be below and updated Tableau


Here is the graph of top seasons in history, still dominated by post-expansion players. Most players fall under a negative adjustment, which is displayed as under the white line y=x. The one cluster of points forming a trend at a greater slope (where 25 pts. -> 60 adjusted pts.) consists of players in the first several seasons in which the point rate was much less.

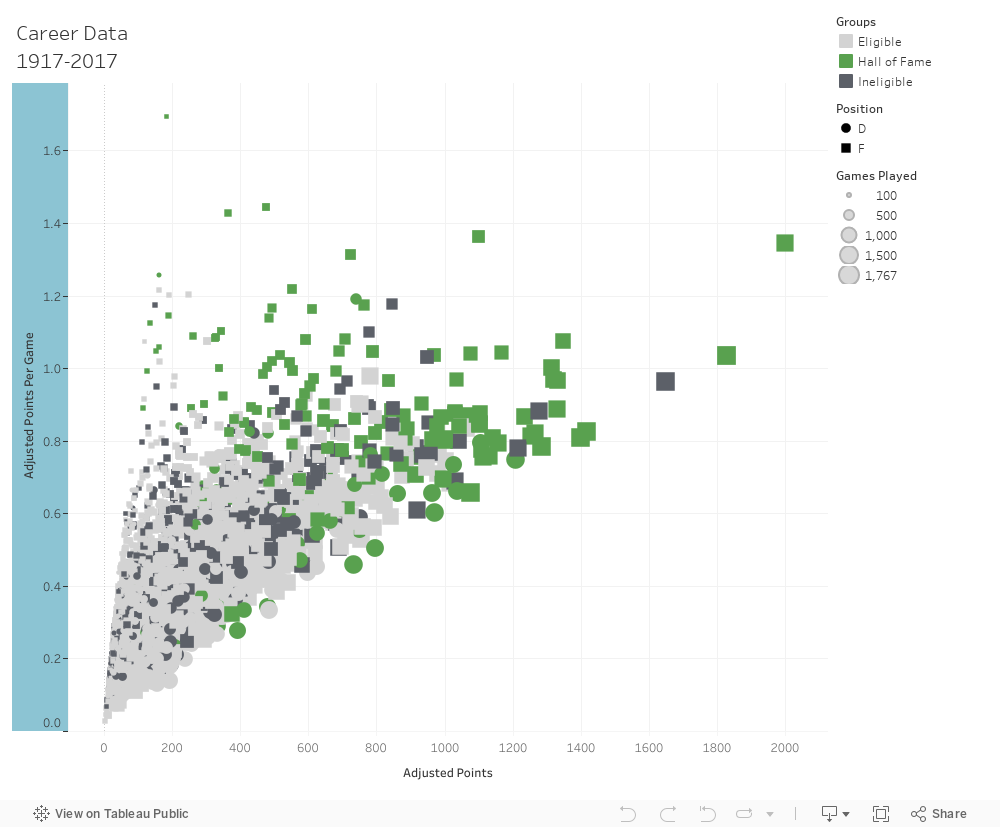
Similarly, here are the career leaders, although the 80s still dominate (in part due to more total GP as there were generally longer seasons and careers than in the past + new era of players haven't retired yet). Nonetheless, there is a much better mix of talent, which helps achieve the original goal of adjusting points.


Just as last time, here are players visualized by hall of fame status. We see that adjusted points generally does a good job of distinguishing which players make the HOF, especially for forwards. Most players in the top right region are either in the HOF or ineligible. As this appeared to be a good indicator, I created a HOF likelihood using logistic regression with the data. With inputs of GP, PPG, adj.P, and Position (F/D) the model was trained using all eligible (including HOFers) careers. The result gives the likelihood a player will make the HOF according to the data. Although position was a statistically significant variable, defensemen simply aren't judged by points on the same level as forwards so the model had a tough time predicting defensemen. On the other hand, the results for forwards appear to have much more value. Overall, HOF status can't be predicted with this few variables as voters place emphasis on awards won as well as international play, which are both out of the current scope. In Stat Shot by Rob Vollman, a HOF model is developed which accounts for these variables and performs very well.


As shown in the visual, the model was applied to ineligible players to get a sense of who we should expect to make the HOF in future years. Here are the top 20s separated by position. Defensemen were given much lower likelihoods than forwards as a group, but Erik Karlsson stands out as an almost lock. We should expect Zubov and Gonchar to eventually make their way in, as expected. The long list of eligibles following the top group are much less likely to get in both on the model's predictions and by looking at the names. Several are past the point of eligibility and the remaining are a group of fringe contenders. Towards the bottom we see Letang leading the group of current players. Other active players of interest with (in my opinion) a likelihood of entering the HOF include Zdeno Chara (0.38) and Drew Doughty (0.22). Showing again that without award recognition, defensive defenseman are ignored.
 The forwards model provides a much clearer picture of what to expect. The top 5 are complete locks by the model and by general public opinion. In the next group are several players that are nearly identical stat-wise to many of the early inductees, but my hockey history knowledge cannot explain why they are omitted and others are not. The next grouping is a list of current era players, most of whom will likely be strong candidates for the HOF in the future. McDavid stands out because of his very strong PPG numbers. When setting a minimum for games played, the list is pretty much what is expected in this current batch of players and Herberts, Denneny, and Carson are omitted.
Here are some scores for players in the HOF as a basis for comparison:
Gretzky - 0.9999280 (Highest F)Orr - 0.9988738 (Highest D)
Lidstrom- 0.9550488 (5th D)
Maurice Richard- 0.9508771 (17th F)
Leetch - 0.9231727 (8th D)
Selanne - 0.9199010 (21st F)
Lindros - 0.8099994 (42nd F)
Hawerchuk - 0.7659057 (48th F)
Bure - 0.6784484 (65th F)
Pronger - 0.66935832 (20th D)
The Worst Scores:
Bob Gainey - 0.002817570 (Lowest F)
Jack Stewart - 0.003486746 (Lowest D)
Finally, here is the updated Tableau for NHL careers. If you mouse over a player you can see their HOF score and the other data used in model.
Comments
Post a Comment